Saturday, June 9, 2018

Moving The Blog

I have decided to move my blog from Blogger to Netlify.

I am a fan of Blogger, it's a great way for people to get themselves online.

I am a bigger fan of R.  I use it regularly.  I never liked having to jump through hoops to format R output to fit in Blogger.

With the 'blogdown' package by Yihui Xie, I can now build posts in R through RStudio, using Hugo.  The compiled files are then saved to my Github repo, and Netlify automatically updates within seconds.

So... the old content will be slowly migrated.

... and the new www.justadatageek.com is now live!

Saturday, May 19, 2018

A(nother) Brief Update... Again...

It's been a while and a lot has happened:
  1. I found full-time employment as a data analyst.
  2. My wife and I purchased a home.
  3. I've finished my master's degree program and graduated.
Now that I have some space and time, I am working on a blog post a bit more interesting than this one.  The plan is to post up at least monthly.  I'd like to post something every other week but I'll (re)start slowly to build up topics, do research, analyze data, and then write.

So... stay tuned!

Tuesday, November 28, 2017

A(nother) Brief Update...

Just to keep things moving, even only slightly, forward with my blog...

I'm still looking for a full-time, permanent job in the Philadelphia area.  I didn't imagine that it would be this difficult, but it would seem that transitioning my skills and experience as an Economist with the Federal government isn't as easy as I thought it would be.

I'm also still working on completing my graduate program, which seems to be going decently well.

This post was originally going to be a continuation of the voting statistics blog that I did in October 2016 has been rendered unnecessary.  The U.S. Census Bureau published an outstanding analysis piece on their website.

So, given all of that information, I am going to look for other economic/finance topics to work on for my next full blog post.

I expect to begin blogging after the fall semester ends and my work load lightens a bit.

I wish everyone a safe, fun, and happy holiday season!

Friday, July 21, 2017

Quick Update And A Graph About Oil Prices

It has been rather hectic of late:
  1. My family and I have moved, and our former home has been sold;
  2. I stopped taking classes at UMUC, a combination of not having enough of either the time or the money necessary;
  3. I am looking for a full-time, permanent job in the Philadelphia area; and,
  4. the boys take up a lot of my free time.
So, I am getting back into the blog slowly with this quick personal update, and (what I think is) a nifty little visualization of oil prices.  I'm sure everyone is familiar with the line chart:

Note: red line is average price over the series.

I found this to be an interesting way to look at oil prices.  It shows the annual variation in the per-barrel price of oil as a boxplot, with the overall average price imposed by the red horizontal line:


If you can ignore the change of price in the last ten or so years, the thing that may catch you eye -- as it did mine -- was that many years don't have much volatility in the price, with the obvious exceptions of 2007 through 2009.

As usual, my R code is in my GitHub repo.

More posts will follow, as I strive to make more time to express myself.  I would like to do a follow up/finishing post on the voter data.  Plus, I want to explore and analyze some other data of economic/financial significance.

Stay tuned.

Friday, January 6, 2017

A(nother) Brief Update

2016 is gone and I find myself nearly one week into 2017, preparing for several changes.

My family and I will be moving back to the Philadelphia area.  My wife and I are both from that area, so we are "going home".  This has been a shared goal of ours, and it has been realized by my wife accepting a position with her employer that is bringing us back to the area.  I am in the midst of job searching.  I have had several interviews and have a few more coming in the next week or two.  The next month or so will be hectic but should pass quickly.

Another, and perhaps more interesting change, is my pursuit of another bachelor's degree.  I have commented on taking (and completing) courses through Coursera in previous blog posts.  I completed the Data Science specialization offered by Johns Hopkins University (which focused on using R) and the Python for Everybody specialization offered by University of Michigan.  These were great for piquing my interest in programming.  After doing a little research, I decided to pursue a Bachelor of Science in Computer Science through University of Maryland University College.  They offer all of their classes online, so the move will not disrupt my class schedule much, and I am financing most of the tuition with my remaining G.I. Bill education benefits -- which would have otherwise expired in August 2018.  To make things even easier, they accept up to 90 credits for applicants who have already earned a bachelor's degree!  That leaves me with just the major requirements to complete the program.

The goal of this is to fill in the blanks in my knowledge and skills in a structured learning environment.  I will finish the computer science program as well as a graduate program in applied economics.  This will allow me to combine my interests in programming, data science, and economics... and hopefully open up more opportunities for me professionally, as well as my personal journey of exploration that I post irregularly on my blog.

Saturday, October 1, 2016

U.S. Presidential Election Participation

After a substantial pause in my blogging, I am back at it.

Another presidential election cycle is in full swing here in the United States.  In between all of the arguing of which candidate is the best choice -- or the lesser evil -- I have heard and read people talking about polling numbers and previous election results.

"Hillary has X% of Americans supporting her!"

"Trump should receive Y% of the votes!"

All of this got me thinking about a debate with some friends about voter turnout.  The point that I brought up then, and will be publishing here, is the stagnant participation rate for voting in the United States.

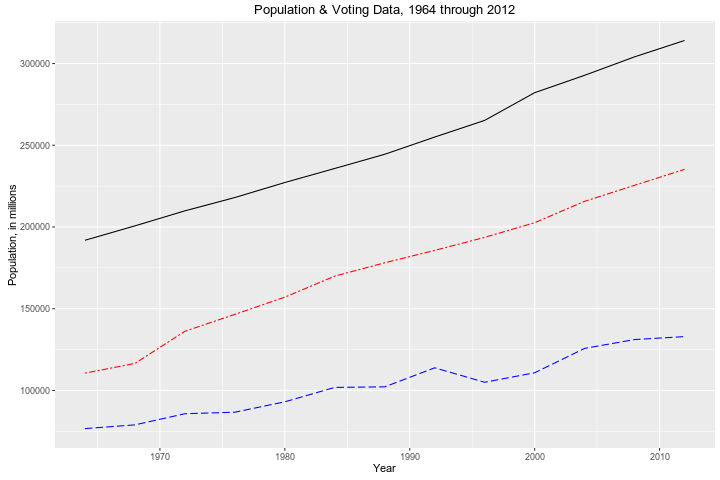
In this first graph, I have charted out the U.S. population estimates as calculated by the U.S. Census Bureau, making presidential election years my observation points:


The solid black line is the estimated total U.S. population.  The red dot-dash line beneath it is the estimated U.S. voting-aged population.  Finally, the blue dashed line at the bottom is the count of the U.S. population that actually voted.  What stands out is the difference between the rate of increase in the population and the rate of of increase in those that vote.

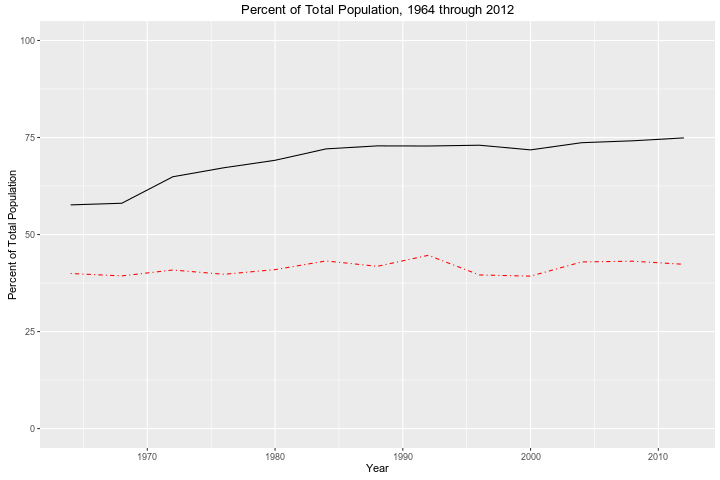
This next graph shows the percentage of voting-aged population to the total population (top, sold blank line) and the percentage of those who voted to the total population (bottom, red dot-dash line).


It appears that the proportion of the population that votes is stable (stagnant?) when compared to the increase in the proportion of the population estimated to be of voting-age in the United States.  Finally, to conclude this post on demographics, below is the percent of voting-aged population that actually votes.  There is some volatility but it appears to be declining over time.


I have no preference in this year's election.  I may actually join the ranks of those who fail to vote... who knows?  And, while I think we will see a slight increase in voter participation in this election cycle, I think that the disturbing trend of decreasing voter participation will continue over the long term.

As usual, I will make the data and the R script used in this post available in my GitHub repository.

I will start working on my next post with the goal of returning my focus to economic topics, but you never know... the Philadelphia Eagles are looking pretty good this season.

Monday, May 16, 2016

A Brief Update

I mistakenly thought I would have time to blog, and I apologize to anyone who has been waiting for me to post something new to read.  Life, both personal and professional, has been going well but has also been extremely busy.

One thing that I would like to comment on before I go any further is the progress I have made through Coursera.  I have been taking courses in both the Data Science specialization track (here) and in the Python for Everybody track (here).

The Data Science track, offered by Johns Hopkins University, has been a great hands-on crash course for using R -- something I have been playing with for years, but never went much further than creating some basic visualizations.  Right now, I am finishing up the certificate program with the capstone project course which combines lessons from the previous courses and adds a twist: performing some Natural Language Processing (NLP).  For this project, JHU/Coursera has partnered with SwiftKey to make data available to the students and provide some background on how NLP works.

The Python for Everybody track has been a great experience with learning Python, especially since my programming skills were pretty minimal.  This is offered through University of Michigan and taught by Dr. Chuck Severance.  So far, I have completed the first three courses in the series.  I have gotten a decent grasp of the basics of using Python, and I am looking forward to using it more while performing data analysis.

Now for the future of this blog.  It shall continue.  I am currently working on two posts: one going back to my interest in oil prices and the other visualizing some macroeconomic variables (interest rates, stock market values, etc.) in the global market.  I plan on having at least one posted next month, as soon as I complete my capstone project.

Thank you for your patience and understanding.
Creative Commons LicenseJust A Data Geek Blog by Richard Ian Carpenter is licensed under a Creative Commons Attribution-NonCommercial-ShareAlike 4.0 International License.