- I received some feedback and updated the third graph in my previous post to include a label for the y-axis.
- I plan to make my R scripts, data, etc. available through my GitHub account at a later date
- I will be adding links to blogs that I follow and websites that I find useful and visit often.
- I am hoping to post up something new every other week, but I am not making any promises on creating a schedule for publishing.
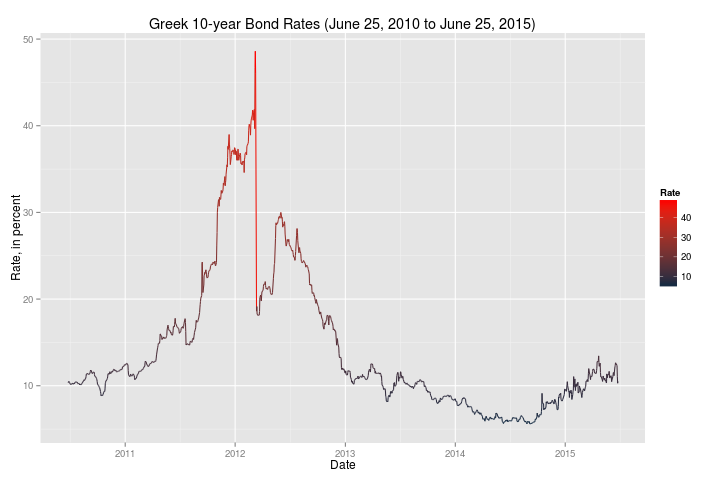
First, here is a historical look at Greek 10-year bond rates:

This plot was made using the "ggplot2" package. Current rates (around the 10% range) are not particularly bad when compared to 2012 and 2013. It did appear to have a steep increase from the beginning of 2015 to the last observed data point.
Then, I created another plot using a narrower time frame to focus on more recent events following the 2008 financial crisis:
These plots (and their data) made me wonder if the market was really reacting to the problems in Greece.
The caveat to these plots, however, is that the last captured observation was June 25, 2015. Quite a lot has happened since then, so I went to Investing.com and pulled data for the trading days of June 25, 2015 through the close of business July 10, 2015:

We can see that there was a jump in the Greek 10-year bond rate that corresponds to the referendum that took place, and the market's reaction to the referendum's outcome.
I took this data and then combined it the data I retrieved from Quandl and created this final plot:

I started working on this blog on Tuesday, and was hoping that Quandl would have updated data -- I am slightly hesitant to append one (very small) data set to another that come from two different sources. Investing.com's data is not formatted for download. I had to manually collect the data from their site in order to create that data set.
Regardless, it leads to a few questions:
- If rates are a sign of risk, how worried was the market in the Greek referendum? (The spike is less than half of the larger spike in 2012.)
- How will this weekend's continued negotiations affect Greek bond rates?
- Like everyone watching events unfold, what would happen if Greece left/were removed from the EU? Or stopped using the Euro and reintroduced the Drachma?

No comments:
Post a Comment